The Data Sitting Idle: What Your Smart Meter Knows That Your Utility Isn't Telling You
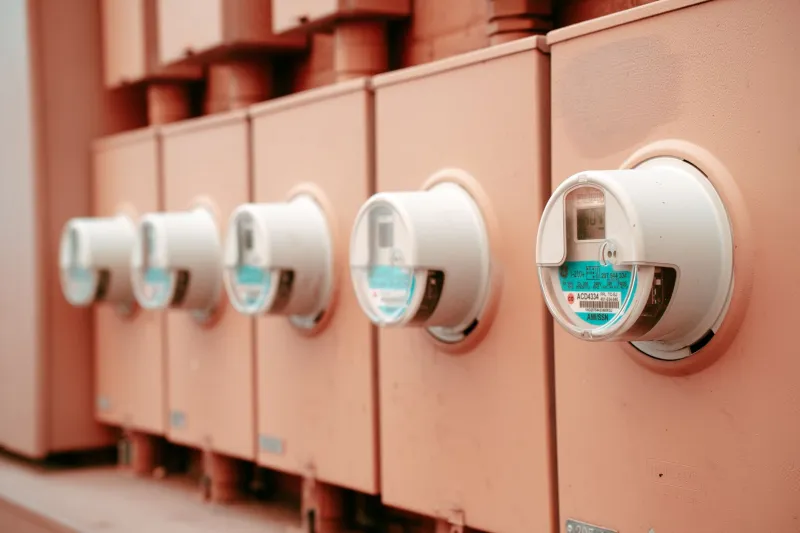
The small gray or white box affixed to the exterior of your home is no longer simply a counter spinning silently in the background, waiting for a meter reader to arrive once a month. Today, the smart meter installed at roughly 130 million American residences—a figure representing more than 70 percent of all US electricity customers, according to the Energy Information Administration—transmits detailed consumption data back to your utility at intervals as short as fifteen minutes. That is a substantial volume of information. The more pressing question is what happens to it once it arrives.
For most households, the answer is: not much of consequence.
What Smart Meters Actually Capture
A conventional analog meter measured cumulative kilowatt-hours—the total electricity consumed since installation, with no time context attached. A smart meter, by contrast, records consumption in discrete intervals throughout the day. Depending on the utility and the meter model deployed, that interval can range from sixty minutes down to fifteen minutes or even five.
This granularity is significant. An interval reading at 6:45 a.m. versus one at 10:30 p.m. carries entirely different implications for how a household operates, what appliances are running, and what it costs under time-sensitive rate structures. Aggregated across days and weeks, these readings sketch a surprisingly precise portrait of domestic life: when residents wake, when they cook, when they run laundry, and how the home responds to shifting outdoor temperatures.
Utilities collect all of this. The transmission infrastructure—the mesh networks and radio frequency communication systems that define most advanced metering infrastructure deployments—was built specifically to carry this data reliably and continuously.
The Gap Between Collection and Application
Here is where the disconnect emerges. Utilities built smart metering programs primarily to serve operational objectives: eliminating manual meter reads, detecting outages faster, identifying theft and tampering, and supporting time-of-use rate structures that help manage grid demand. These are legitimate and consequential goals. However, they are largely utility-facing benefits, not customer-facing ones.
When it comes to translating that interval data into actionable guidance for individual households, most utilities fall short. Monthly bills still present aggregated totals. Notifications about unusual consumption spikes are inconsistent across providers. Personalized recommendations tied to specific usage patterns remain the exception rather than the rule, largely confined to a handful of utilities that have invested in behavioral analytics platforms or partnered with third-party energy management firms.
The reasons are varied. Legacy billing systems were not designed to ingest and display interval data at the customer level. Privacy regulations governing how utilities may use and share granular consumption data vary by state and create compliance complexity. And frankly, the business incentive for a regulated utility to help customers consume less electricity is structurally complicated in ways that disincentivize aggressive efficiency outreach.
None of this means the data is inaccessible. It means the utility is unlikely to hand it to you with a useful interpretation already attached.
How to Access Your Own Interval Data
Most utilities operating smart metering programs are required to make interval data available to customers upon request, and a growing number have built online portals where this information can be downloaded directly. The format is typically a spreadsheet or CSV file containing timestamped consumption readings across whatever interval your meter supports.
The starting point is your utility's online account portal. Look for sections labeled "My Energy Use," "Green Button Data," or "Usage Details." The Green Button initiative—a voluntary but widely adopted standard developed in partnership with the US Department of Energy—was specifically designed to standardize how utilities export this data, making it portable and compatible with third-party analysis tools.
If your utility participates in Green Button Connect My Data, you can authorize third-party applications to pull your interval data directly, enabling ongoing analysis without manual downloads. Several independent platforms and home energy management applications accept this authorization and provide visualizations, anomaly detection, and efficiency recommendations that most utility portals do not offer natively.
Interpreting the Patterns That Emerge
Once you have access to interval data, the analysis need not be technically complex to be useful. A few straightforward observations can yield meaningful insights.
Baseline consumption during unoccupied hours. Examine usage between roughly 2:00 a.m. and 5:00 a.m., when the household is typically dormant and most controllable loads are off. This figure represents your home's standing electrical draw—the combined appetite of refrigerators, network equipment, clocks, and anything else that never truly powers down. If this baseline exceeds one kilowatt-hour per hour, there is likely an efficiency opportunity worth investigating.
Morning and evening peaks. The intervals surrounding your household's wake and wind-down routines typically show the sharpest consumption spikes. Identifying exactly when these peaks occur, and how large they are, helps clarify whether shifting certain loads—dishwashers, EV chargers, laundry appliances—away from these windows could reduce costs under time-of-use pricing.
Seasonal anomalies. Comparing equivalent weeks across different seasons can surface equipment behavior that isn't otherwise visible. An aging HVAC system, for example, may show progressively longer runtime intervals over successive summers as its efficiency degrades—a pattern invisible on a monthly bill but apparent in interval data.
Unexpected overnight activity. A sharp consumption spike at an unusual hour—say, 3:00 a.m. on a Tuesday—can indicate a malfunctioning appliance, a water heater cycling excessively, or a device operating on a schedule the homeowner has forgotten or never set intentionally.
Turning Passive Infrastructure Into an Active Tool
The smart meter was installed to serve the grid. There is no reason it cannot simultaneously serve the household it monitors. The data already exists. The transmission already occurs. What has been missing, in most cases, is a clear pathway for homeowners to claim that information and put it to work.
At Pipps Energy, we believe that the relationship between a utility and its customers should be genuinely reciprocal—that the intelligence gathered from your home's consumption patterns carries an obligation to return something of value to you in exchange. Interval data, properly interpreted, can inform decisions about appliance upgrades, insulation investments, rate plan selection, and behavioral adjustments that collectively reduce both energy expenditure and environmental impact.
The meter is already watching. The question is whether you are watching back.