Why Your Energy Bill Refuses to Drop: The Standby Power Problem Most Households Never Solve
There is a particular frustration familiar to energy-conscious homeowners across the United States. They have done everything right—replaced incandescent bulbs, programmed the thermostat, shortened shower times, and unplugged chargers before bed. Yet when the monthly statement from their utility provider arrives, the numbers look almost identical to the year before. The savings plateau feels inexplicable.
In most cases, the explanation is not a failure of effort. It is a failure of measurement. The culprits are not the appliances running in plain sight. They are the devices drawing current in silence, around the clock, while appearing completely inactive. In the energy industry, this phenomenon is called phantom load—and for the average American household, it accounts for a surprisingly substantial share of annual electricity consumption.
What Phantom Load Actually Costs
The Lawrence Berkeley National Laboratory has estimated that always-on devices in a typical U.S. home consume between 5 and 10 percent of total residential electricity use. For a household averaging 900 kilowatt-hours per month—close to the national median—that translates to between 45 and 90 kWh of power consumed each month by devices doing essentially nothing useful.
At the national average retail electricity rate of approximately 16 cents per kilowatt-hour, that range represents $87 to $173 per year, simply to keep devices in a ready state. For households with larger entertainment systems, multiple home office setups, or older electronics, the figure can climb considerably higher.
The problem is not that any single device draws an alarming amount of power on its own. The problem is accumulation. Dozens of modest draws, operating continuously across 8,760 hours per year, compound into a meaningful and entirely avoidable expense.
The Devices Measurement Data Actually Implicates
Generic energy-saving guides frequently advise readers to unplug phone chargers and laptop adapters when not in use. That advice is not wrong, but it targets some of the smallest offenders while leaving the largest ones undisturbed.
Real-world measurement data collected through residential power monitoring studies consistently points to a different roster of primary culprits:
Cable and satellite set-top boxes rank among the most significant phantom load sources in American homes. Unlike most consumer electronics, many cable boxes are designed to remain in a near-active state continuously, performing overnight software updates and maintaining a live signal connection. Measured standby draw for a typical cable DVR unit ranges from 15 to 25 watts—operating 24 hours a day, that single device can consume more than 175 kWh annually.
Smart televisions in standby mode draw between 1 and 5 watts depending on manufacturer and model year, but households with multiple sets—a living room television, a bedroom unit, and perhaps one in a home office—accumulate that draw across all devices simultaneously.
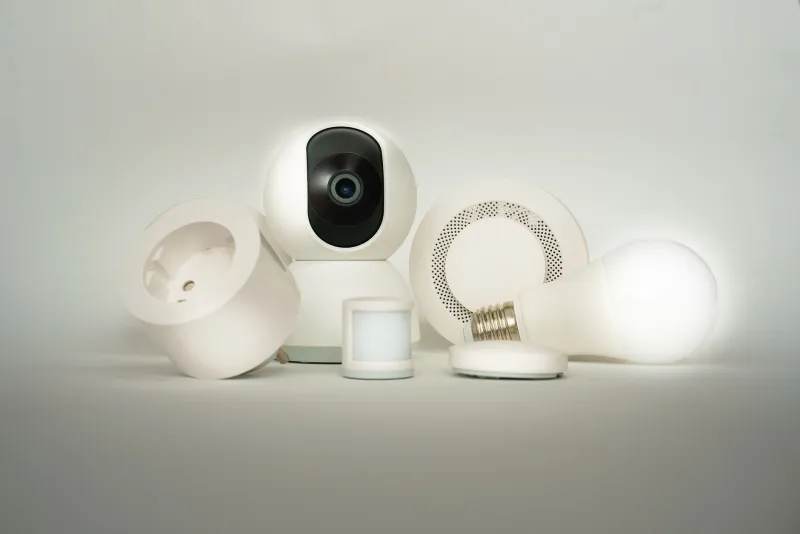
Smart speakers and voice-activated assistants maintain persistent microphone listening states that require continuous power. A single device may draw only 2 to 3 watts, but a home with four or five units distributed across rooms sustains that draw without interruption.
Gaming consoles, particularly older models and those configured with automatic update settings, can draw 10 to 15 watts in standby. Some models, when left in certain power states rather than fully shut down, draw nearly as much as they do during light gaming activity.
Home networking equipment—routers, cable modems, network switches, and Wi-Fi range extenders—runs continuously by design and draws between 5 and 20 watts per device. While this consumption is largely unavoidable for households that require internet connectivity, older or oversized equipment often draws more than necessary for the actual load it serves.
How to Identify Your Specific Culprits
The most effective approach to a phantom load audit is direct measurement rather than estimation. Plug-in power monitors, available from major retailers for between $10 and $30, allow any homeowner to measure the actual wattage drawn by individual devices across any power state—active, idle, or standby.
The process is straightforward. Plug the monitor into a standard outlet, connect the device in question, and observe the wattage reading across different operating states. Most monitors also calculate projected monthly and annual cost at a user-defined electricity rate, translating watt readings directly into dollar figures.
For a thorough audit, measure each device in your home individually. Pay particular attention to entertainment centers, home office setups, and any area where multiple devices share a power strip. Record the standby draw for each device and calculate the annual cost. The results frequently surprise even attentive homeowners.
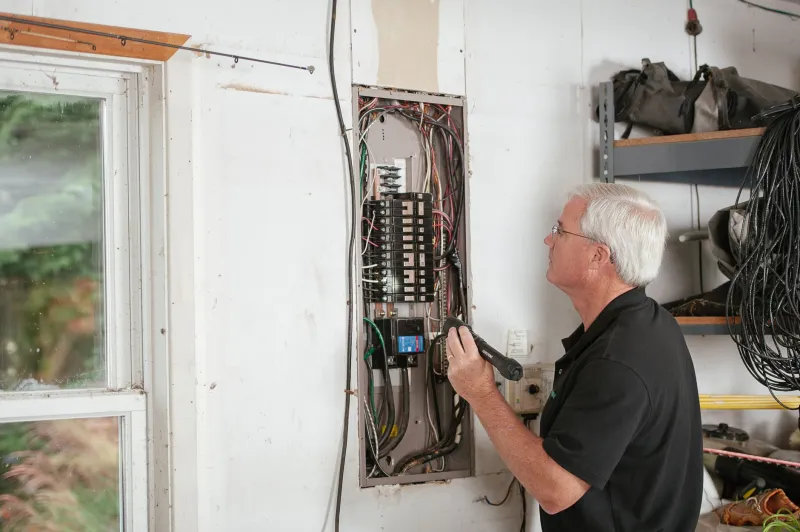
For whole-home visibility, smart electrical panels and whole-home energy monitors—such as those that connect to the main service panel—can identify circuit-level consumption patterns and flag circuits with unexpectedly high baseline draws, which may indicate wiring inefficiencies or malfunctioning equipment in addition to phantom load.
The ROI Question: Unplug, Replace, or Manage?
Once specific devices are identified, homeowners face a practical decision about how to address them. The options carry different costs and different returns.
Smart power strips with automatic shutoff functionality cut power to peripheral devices when a primary device—such as a television—is turned off. These typically cost between $25 and $50 and can eliminate phantom load from an entire entertainment center without requiring any change in household behavior. For setups with high standby draws, payback periods measured in months are common.
Replacing older devices with current-generation models is often justified on phantom load grounds alone, independent of performance improvements. Modern smart televisions draw significantly less in standby than models manufactured five or more years ago. Current-generation gaming consoles have introduced more aggressive power management features. If a device is both inefficient in active use and drawing substantial standby power, the combined savings case for replacement strengthens considerably.
Scheduled outlet timers offer a low-cost solution for devices that do not need to remain in standby overnight. A cable box that powers down between midnight and 6 a.m. via a timer loses no practical functionality for most households while eliminating six hours of continuous draw daily.
For devices that genuinely require continuous power—networking equipment being the most common example—the focus should shift to right-sizing. A household with modest internet demands may be running a commercial-grade router drawing far more power than necessary. Matching equipment capacity to actual household need reduces unnecessary consumption without sacrificing performance.
The Plateau Has a Cause—And a Solution
The savings plateau that frustrates so many energy-conscious households is not evidence that further progress is impossible. It is evidence that the most commonly recommended efficiency measures have already been implemented, and that the remaining opportunity lies in a category of consumption that standard advice rarely addresses with sufficient specificity.
At Pipps Energy, we encourage customers to move beyond the checklist approach to energy efficiency and toward a measurement-driven understanding of where their electricity actually goes. Phantom load is not a minor footnote in residential energy consumption. For many households, it represents the single largest remaining source of preventable waste—and one that a $20 power monitor and an afternoon of methodical testing can bring fully into view.
The utility bill that refuses to drop despite your best efforts is not a mystery. It is a measurement problem waiting to be solved.